In the WeSmellBetter Facebook Group, Bill Gaskins said, “It would be interesting to look for a quantitative correlation to see success rates by region. Does Texas do better than NJ and so on…” This posts begins that analysis, looking at Q rates by class for each of the five AKC Scent Work Regions. I only pulled the 2025 data because I think the question is “where are we now?” as opposed to “how has it gone since the beginning?”
As a reminder, the AKC defines the Regions like this
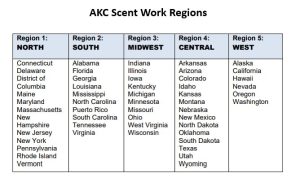
Note that the AKC Scent Work Master National results in terms of starters and qualifying scores for Days 1 and 2 of the Championship are included in Midwest / Region 3 data (Ohio) for 2025.
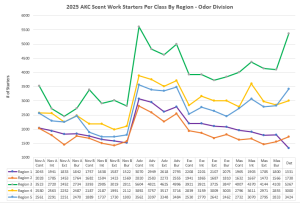
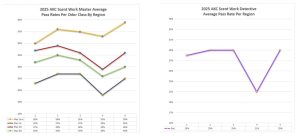
Looking at the Odor Division first, this graph shows the number of starters per class by Region
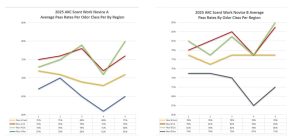
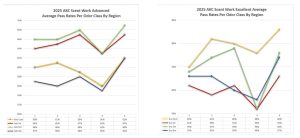
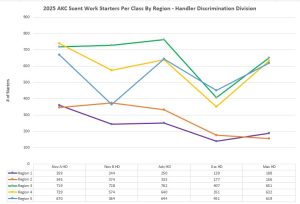
And the pass rates per class by Region:
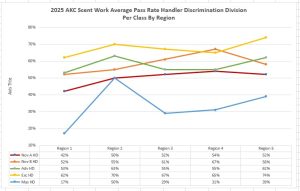
And for the Handler Discrimination Division, the number of starters
And the pass rate per class by Region
There is definitely a bigger difference between Regions than I expected. What do you think?
I wonder if there is any correlation between total population by region and the number of starters.
I wonder if there is any correlation between total population by region and the number of starters.